More about the CAVA framework
CAVA.RmdCAVAanalytics is part of a broader framework, called CAVA (Climate and Agriculture Risk Visualization and Assessment) designed to democratize access and usability of climate information. CAVA is developed jointly by The Food and Agriculture Organization of the United Nations (FAO), the University of Cantabria, Predictia and the University of Cape Town. The university of Cantabria and Predictia are also the developers of the Copernicus Climate Atlas.
How CAVA Differs from Other Tools
Unlike existing platforms such as the COPERNICUS Climate Atlas and the IPCC Interactive Atlas, CAVA provides country-specific, agriculture-focused insights tailored to decision-makers in food security and environmental sustainability.
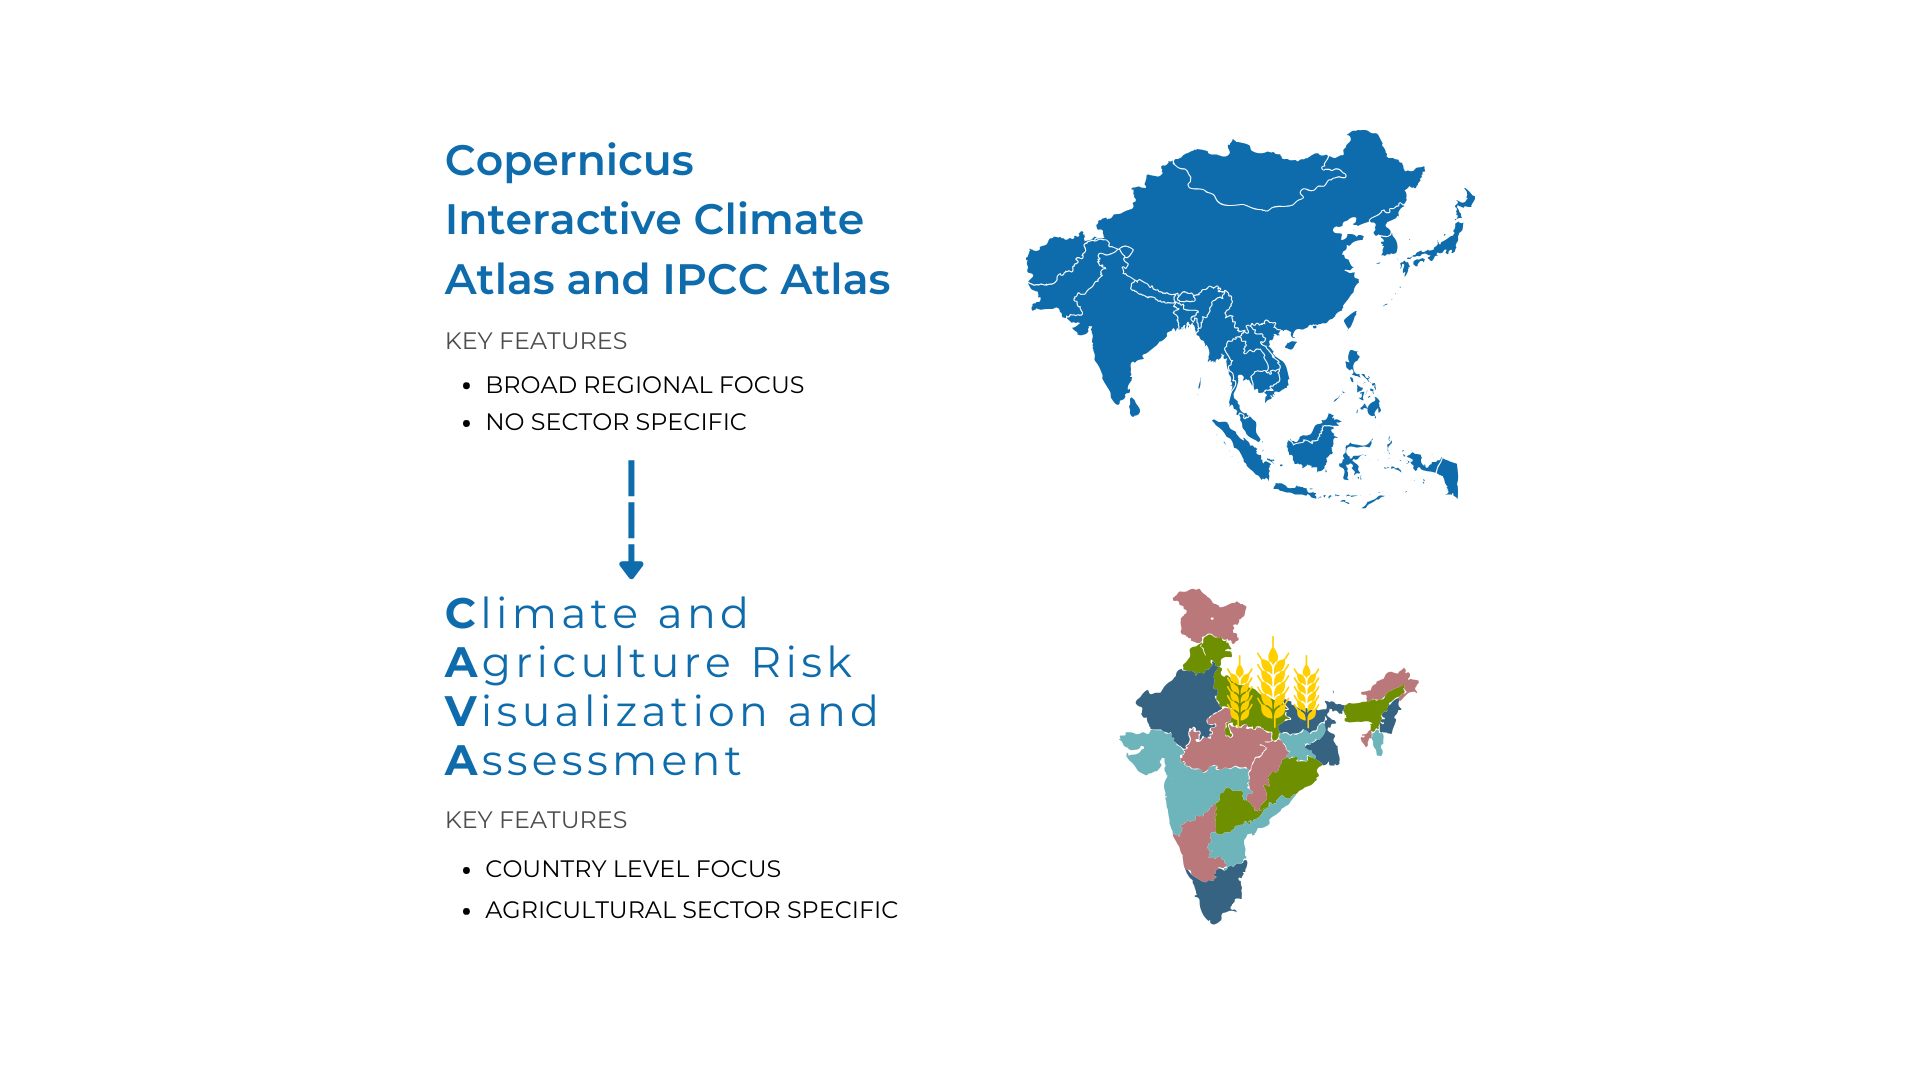
CAVA can be conceived as a specialised tool compared to the IPCC Interactive Atlas and the COPERNICUS Climate Atlas. These tools are complementary with each other and the selection of the right application depend on the user needs.
How CAVA Works
Accessing climate data has traditionally followed two main paths: tools like the IPCC Interactive Atlas provide visuals, while platforms such as ESGF offer raw climate model data for expert analysis. This divide has often left those with intermediate expertise—who need both visualization and data access—without an ideal solution.
CAVA bridges this gap by offering a flexible, user-friendly ecosystem tailored to a wide range of users. Whether you prefer a graphical interface for intuitive exploration or direct access to climate model outputs for in-depth analysis, CAVA has you covered.
The platform is built around two core components:
CAVAPlatform GUI: A freely accessible, interactive platform designed for users who need climate and agricultural insights without the complexity of coding. It presents key data in a clear and intuitive format.
CAVAanalytics: A powerful tool for users comfortable with R programming, providing direct access to climate model outputs and enabling the calculation of climate indicators across multi-model ensembles.
cavapy: Python library designed to streamline the retrieval of datasets made available by CAVA.
By combining these tools, CAVA ensures accessibility for both non-technical users seeking clear insights and researchers or analysts requiring advanced capabilities.
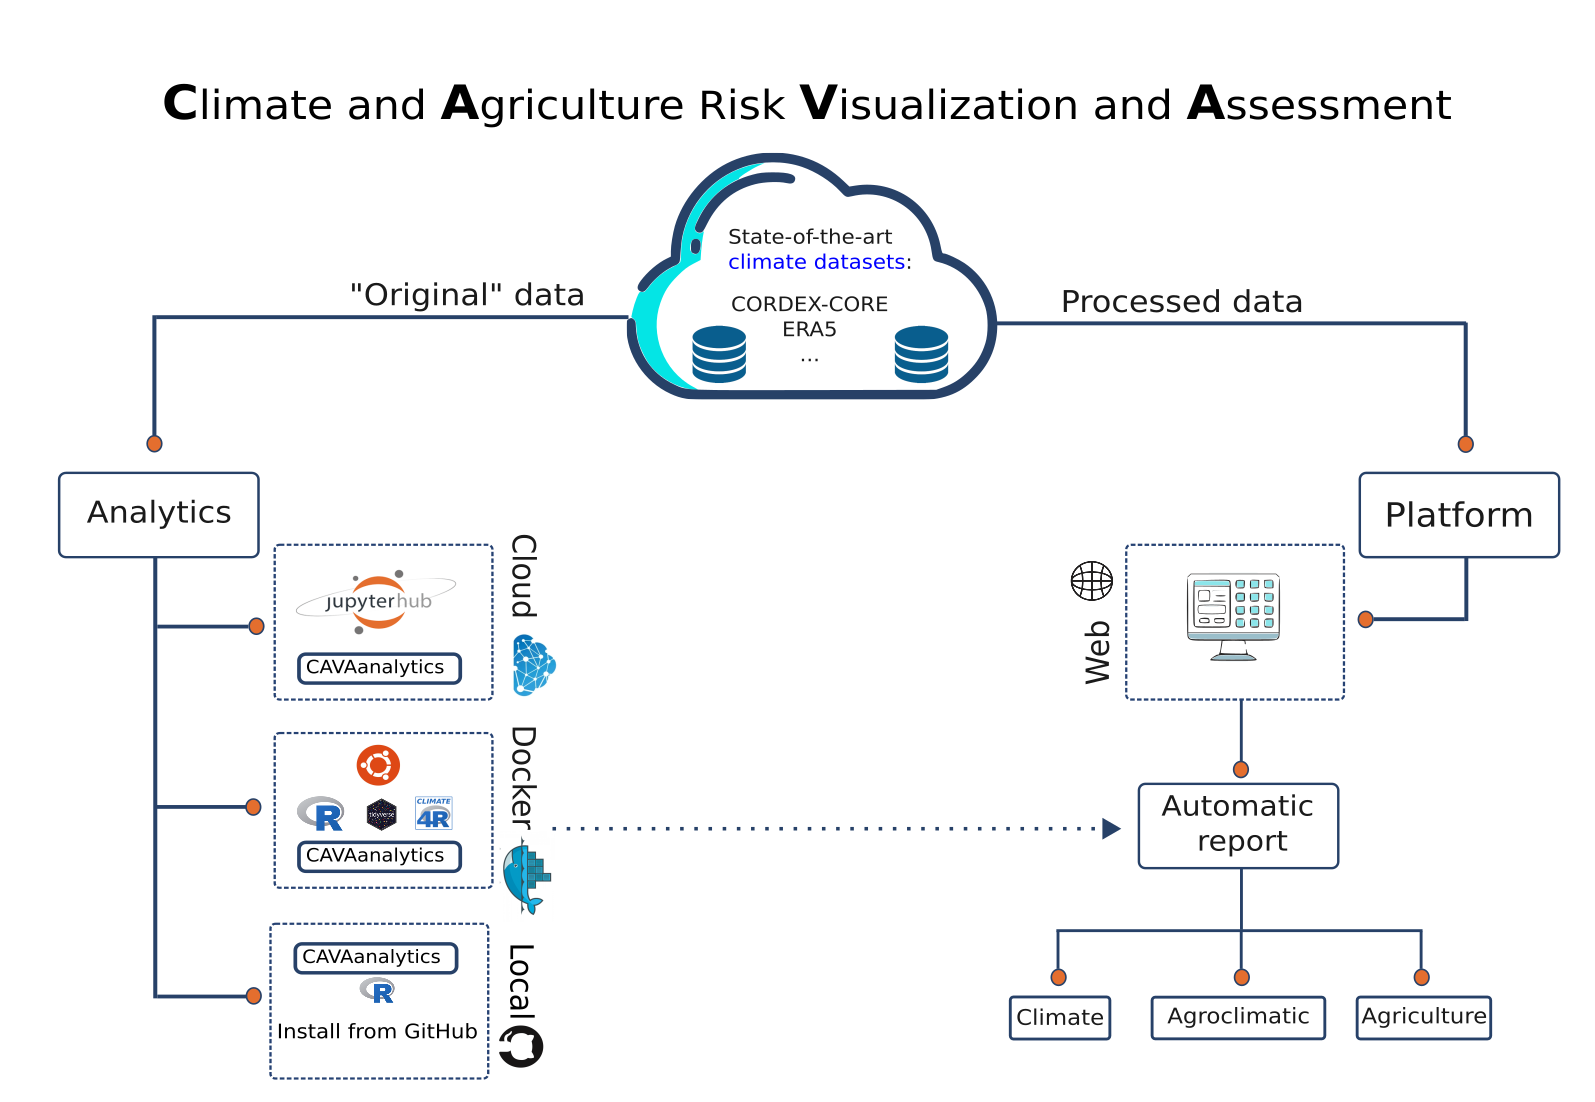
CAVA can be used through a graphic user interface (CAVA Platform) or through the CAVAanalytics R package. The package can be used locally (GitHub installation), remotely (University of Cantabria JupyterHub), or locally but through a Docker image to solve dependencies issues. CAVA Platform offers three types of automatic reports, namely climate, custom climate indexes, and agriculture. The climate and agroclimatic reports are produced with CAVAanalytics
CAVA is structured around two primary modules, each designed to provide key insights into climate and agricultural impacts.
Climate module: Provision of climate information from regional climate model outputs (CORDEX-CORE and reanalyses datasets)
Agriculture module: Provision of impact information from the Inter-Sectoral Impact Model Intercomparison Project (ISIMIP3)
Climate module
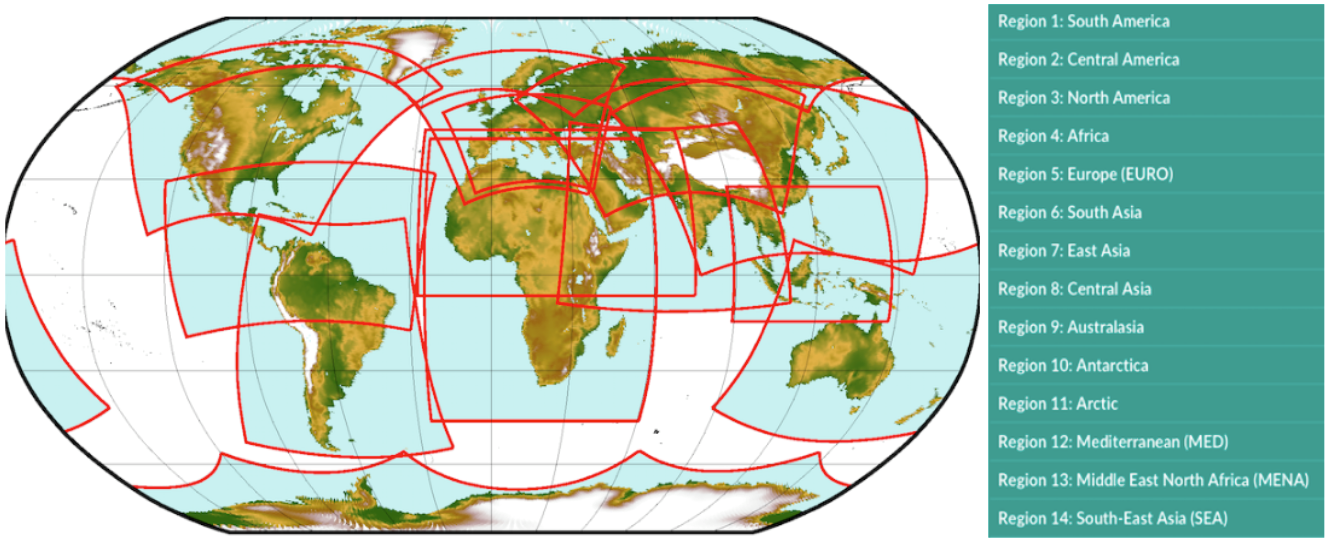
CAVA makes use of outputs from Regional Climate Models. These models are used to downscale Global Climate Models at higher spatial resolution. The project in charge of providing Regional Climate Models is called CORDEX (Coordinated Regional Climate Downscaling Experiment). The outputs of these models are available for specific geographical areas around the world, called domains. More information about the data behind CAVA can be found here.
Agriculture module
The Agriculture Module is under development with the aim of providing streamlined visualization and access to agricultural impact model outputs, courtesy of the Inter-Sectoral Impact Model Intercomparison Project (ISIMIP3).
Through these two specialized modules, CAVA is committed to providing comprehensive and accessible climate and agricultural impact data. By structuring the platform into distinct yet complementary components, CAVA ensures that users can seamlessly explore and leverage critical information, empowering informed decision-making in climate science and agricultural planning.